Consumer behavior, in an online environment, has been tracked and studied for the better part of the last 25 years. Yet, obtaining comprehensive real-time insights into online consumer behavior remains tricky because variables are constantly changing on both ends of the eCommerce experience.
Just as companies begin to understand consumer behavior and begin tailoring a user experience that drives higher conversion rates and purchases, consumers pivot and change their behavior. Consumer expectations also drive this back-and-forth, because once customers become accustomed to a new way of online purchasing, they expect uniformity across all their online purchases.
If Instacart, for instance, makes upgrades to its app that make it easier to select ingredients for an entire meal, that level of thoughtfulness and customization will soon be expected by their users when they begin shopping for workout equipment or home furnishings. Suffice to say, company innovations and corresponding consumer expectations continually move targets relating to eCommerce data.
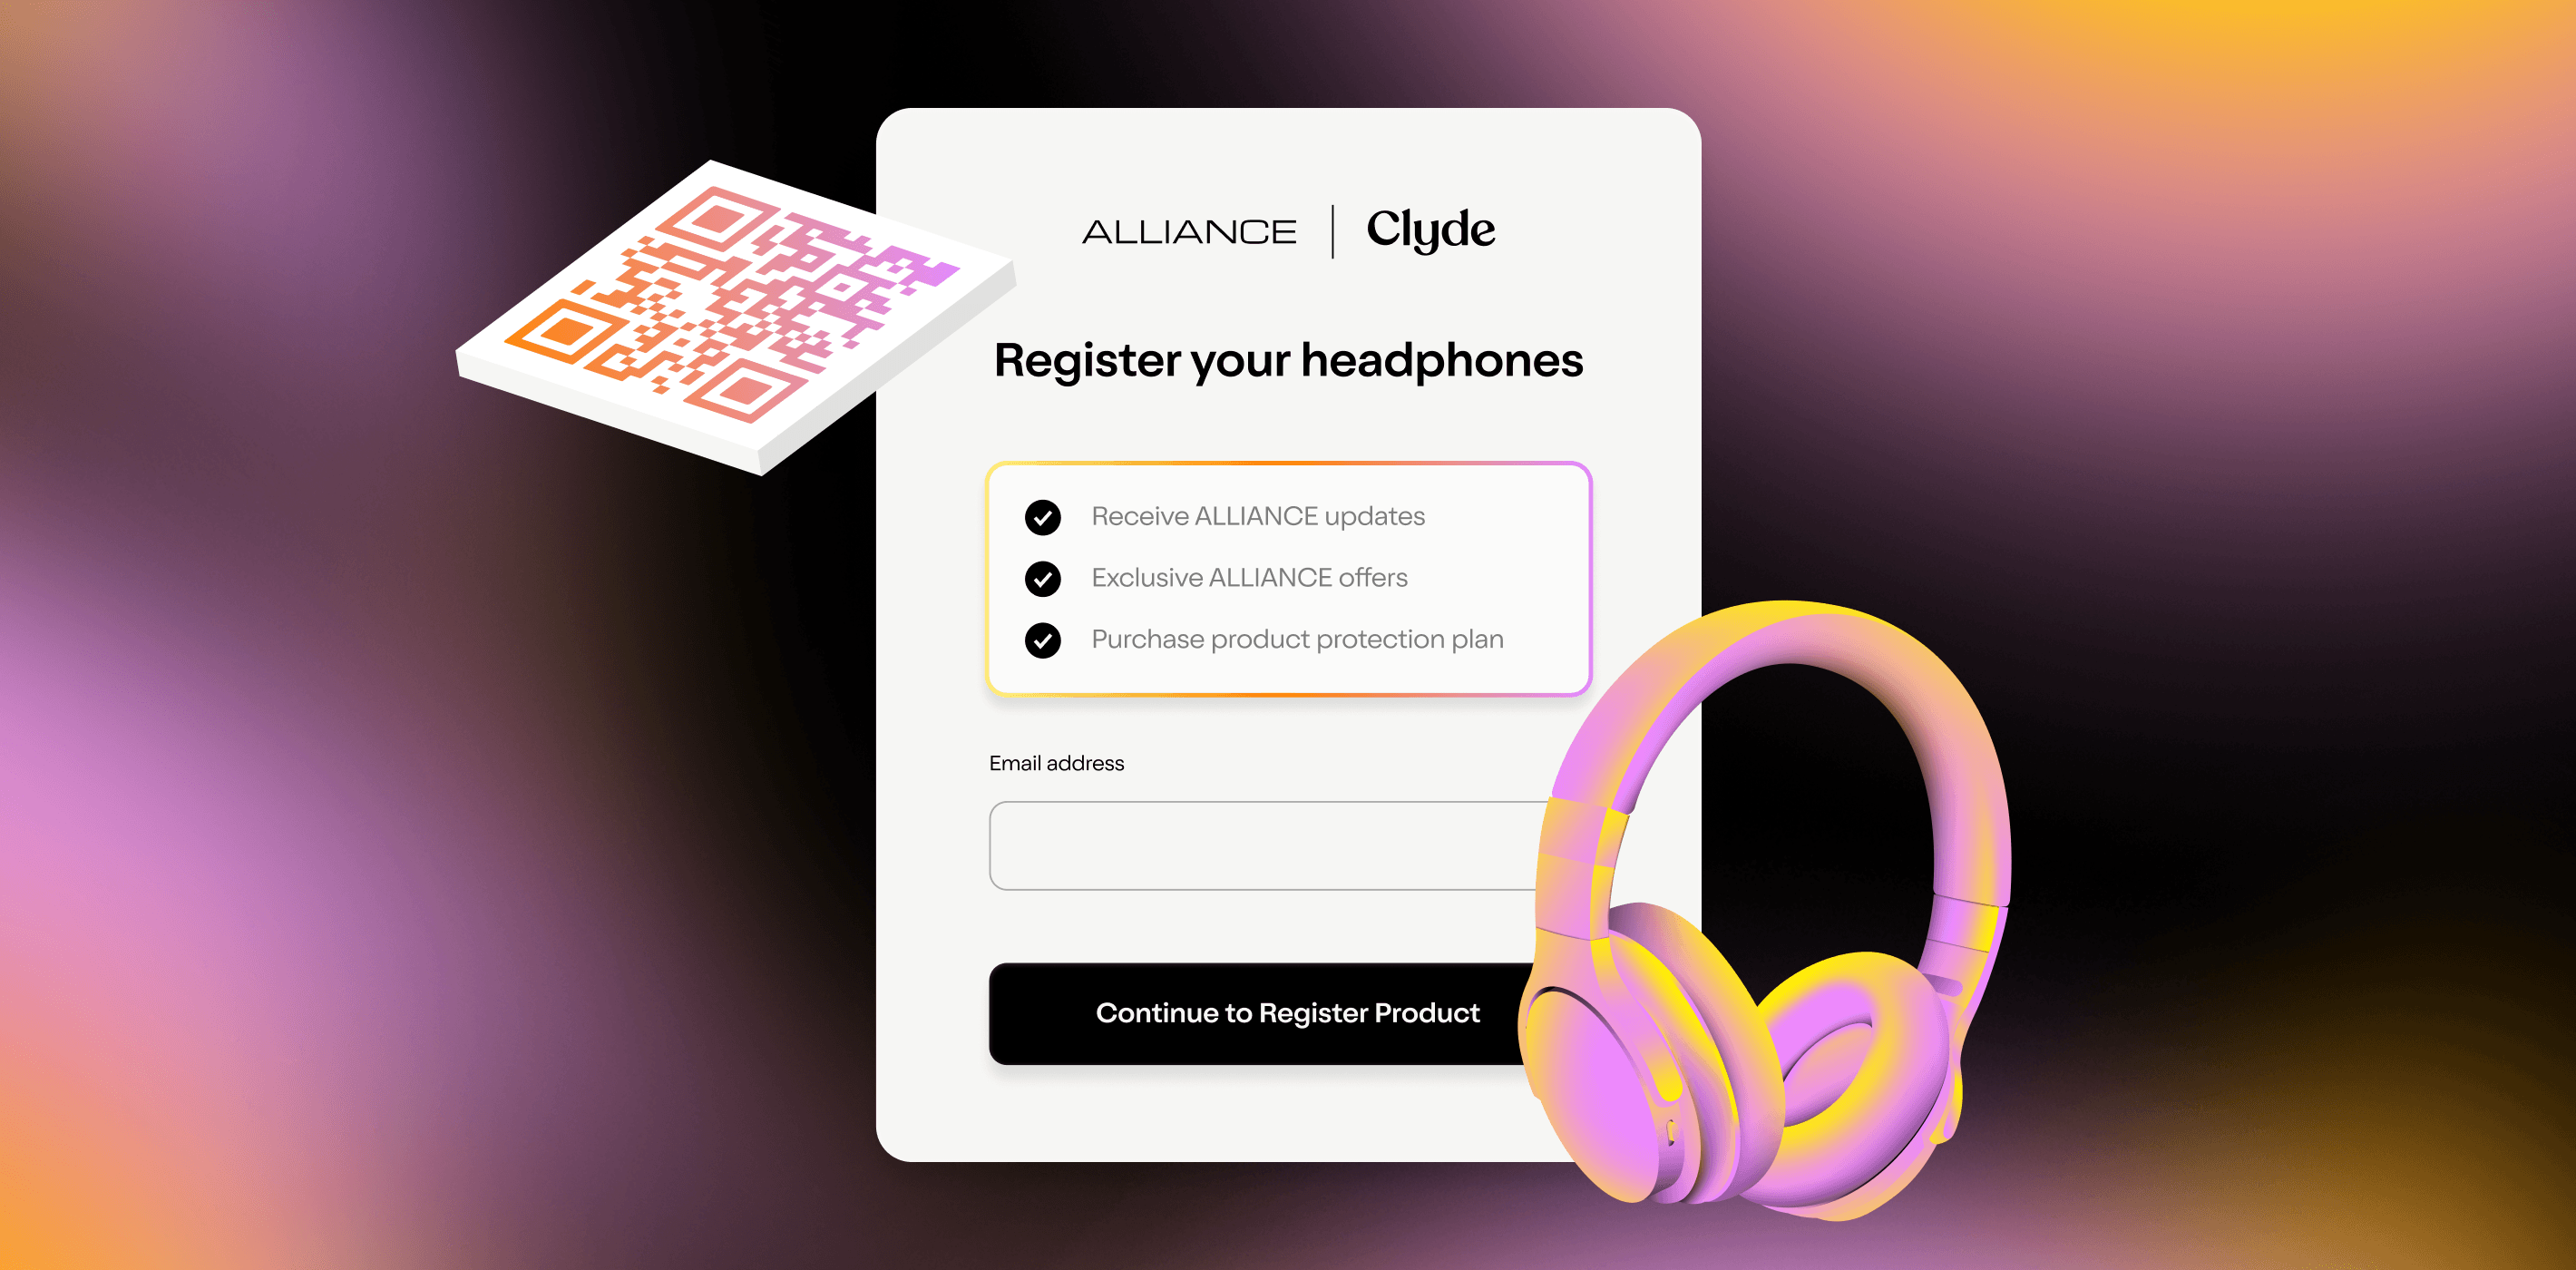
That’s why it’s imperative for companies to partner with an internal or external data science team so they can fully understand their customer data in real-time. Understanding your customers and tailoring an experience that they like and that simultaneously drives higher revenue is the name of the game. We observe this two way-street between consumers and companies in the form of CTA/prompt data every day. Our merchants provide an online experience layered with CTAs with the intent of driving consumers to purchase warranties. Each click generates information, and in aggregate, gives both the merchant and Clyde insight into what drives consumer behavior.
We spoke with our own Monika Heinig about analyzing eCommerce data and how she has helped our customers. Dr. Heinig has a PhD in Mathematics and years of experience leading meaningful data projects. She zeroed in on several key trends that have allowed our customers to increase their attachment rates with the click of a button.
Attach Rate By Prompts
Across our data, we’ve found a direct correlation between additional CTAs/prompts and attachment rates (“AR”). Specifically, attachment rate doubles on average when an online store increases its prompts from one to two. Enticing more customers to add a protection plan or warranty by doubling your prompts confirmed a commonly held belief that consumers needed to be reminded in multiple locations on the screen or phone that an additional service was available. What was far more interesting however, was that this doubling of attachment rates also held strong for companies making a jump from two to three prompts. A 4x increase in attachment rates by moving from one prompt to three prompts has held steady across our data in the past six months. The returns beyond three prompts appear to plateau and begin to infringe upon a clean and smooth user experience for consumers.
A 4x increase in attachment rates when moving from one prompt to three prompts has held steady across our data in the past six months.
Attach Rate Placement
In addition, our data have been able to determine the most effective location to place a prompt. Locations were broken down into three buckets: cart, modal/pop-up, and product page. Product page has lower success rates compared to attach rates at point of sale. The two-horse race between cart and modal/pop-up proved to be competitive at first glance, but as we aggregated more and more data over time, it became clear that the modal/pop-up option is more effective. Our current customers report nearly twice the AR with modals when offering just a single prompt.
For eCommerce businesses interested in both maximizing their AR and maintaining a natural user experience devoid of clutter, fields, and pop-ups that slow purchases, our data is instructive. We’ve identified which two prompts, working in tandem, produce the highest AR. Naturally, the combination of cart and modal checked in with the highest rate, but it was worth noting that the combination of product page and modal prompts was 66% more effective than product page and cart prompts when working in tandem.
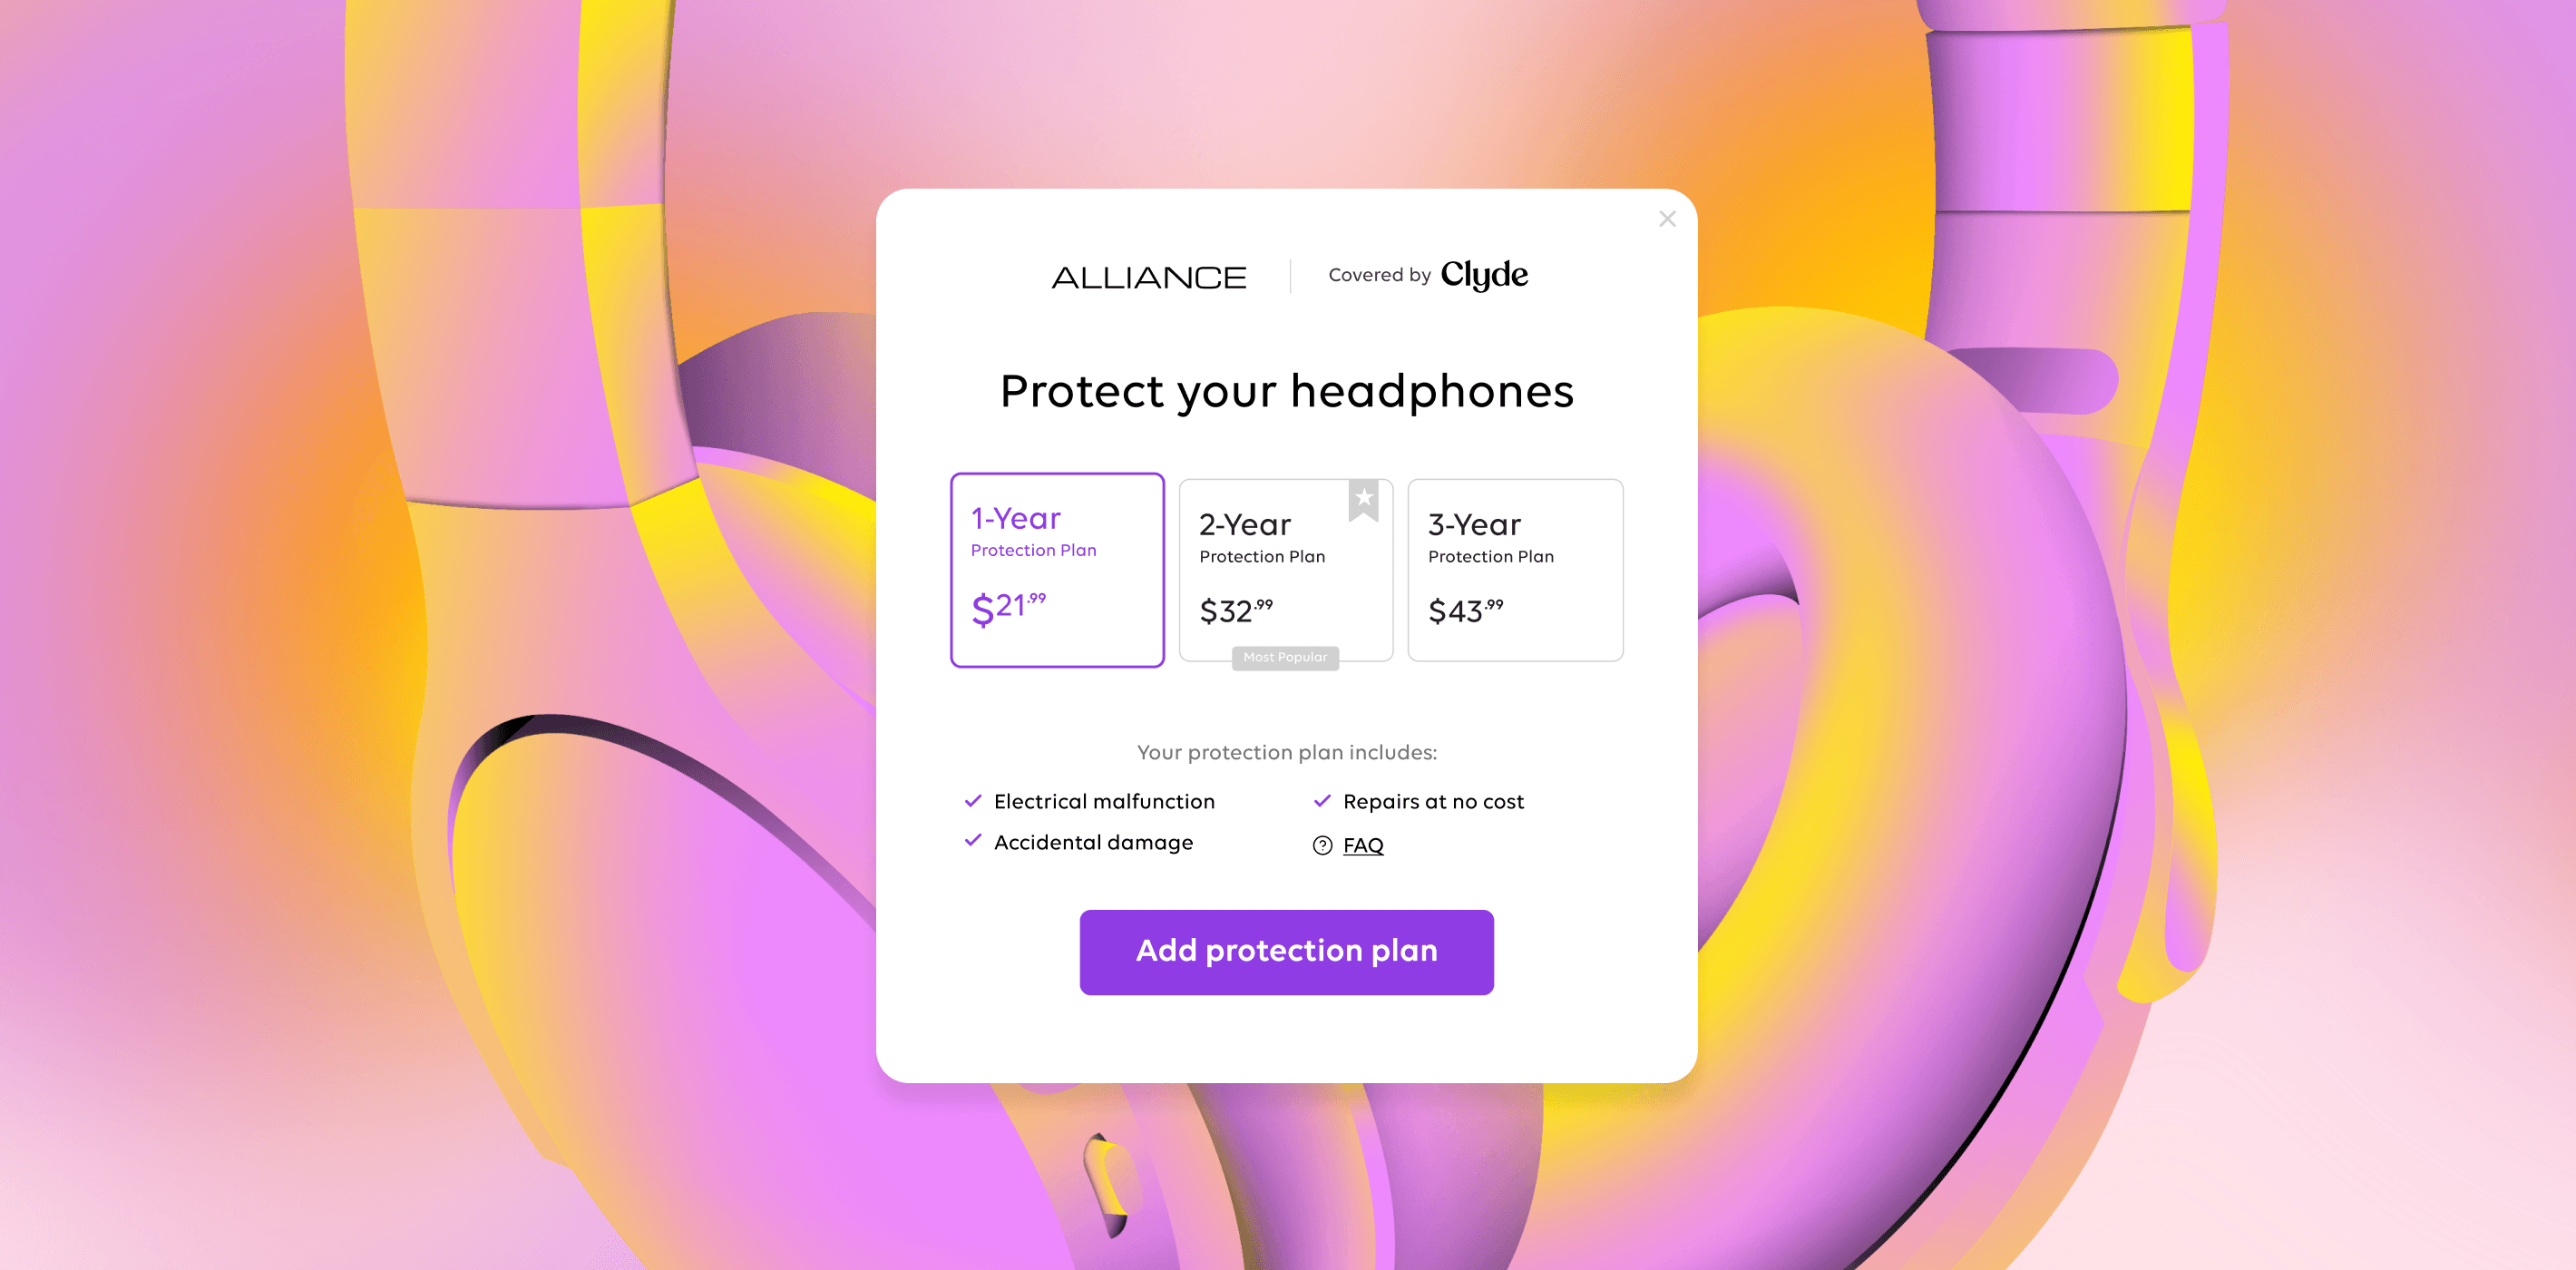
Visuals Matter
As a company, Clyde provides our customers with insights into their overall checkout experience. Unsurprisingly, that includes all of the visual variations that impact a consumer's decision-making process. The options to the left may seem fairly similar, but the data has proven that the second option (oriented horizontally) has driven 94% higher ARs than the next highest-rated prompt. The horizontal prompt also achieved the goal of customers selecting the second or third highest priced option more often than any other prompt option.
Our design team receives feedback from our customers to continue this refinement process and we’re able to capture consumers’ feedback (in the form of clicks) in real-time. This experimentation that spans visuals, copy, and layout essentially boils down to a try, check, revise methodology. If you’d like to learn how Clyde can help drive revenue and optimize the warranty customer experience, schedule a demo today .
SIGN UP FOR OUR NEWSLETTER